In this tutorial, you will figure out how to use the mAP (mean Average Precision) metric to evaluate the performance of an object detection model. I will cover in detail what is mAP, how to calculate it, and give you an example of how I use it in my YOLOv3 implementation.
The mean average precision (mAP) or sometimes just referred to as AP. That's a popular metric used to measure the performance of models doing document/information retrieval and object detection tasks. So if from time to time you read new object detection papers, you may always see that authors compare mAP of their offered methods to the most popular ones.
Multiple deep learning object detection algorithms exist like RCNN's: Fast RCNN, Faster RCNN, YOLO, Mask RCNN, etc. All of these models solve two significant problems: Classification and Localization:
- Classification: Identify if an object is present in the image and the class of the object;
- Localization: Predict the coordinates of the bounding box around the object when an object is present in the image. Here we compare the coordinates of ground truth and predicted bounding boxes.
While measuring mAP, we need to evaluate the performance of both classifications and localization using bounding boxes in the image.
For object detection, we use the concept of Intersection over Union (IoU). IoU measures the overlap between 2 boundaries. We use that to estimate how much our predicted boundary overlaps with the ground truth (the actual object boundary):
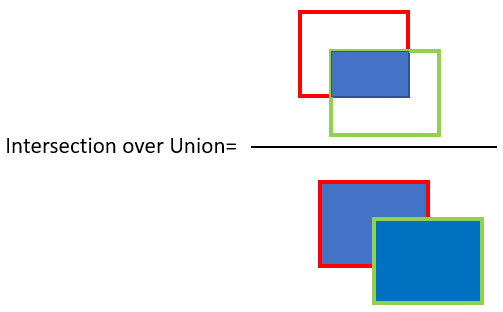
- Red - ground truth bounding box;
- Green - predicted bounding box.
In simple terms, IoU tells us how well predicted and the ground truth bounding box overlap. You'll see that in code, we can set a threshold value for the IoU to determine if the object detection is valid or not.
For COCO, AP is the average over multiple IoU (the minimum IoU to consider a positive match). AP@[.5:.95] corresponds to the average AP for IoU from 0.5 to 0.95 with a step size of 0.05. For the COCO competition, AP is the average over 9 IoU levels on 80 categories (AP@[.50:.05:.95]: start from 0.5 to 0.95 with a step size of 0.05). The following are some other metrics collected for the COCO dataset:
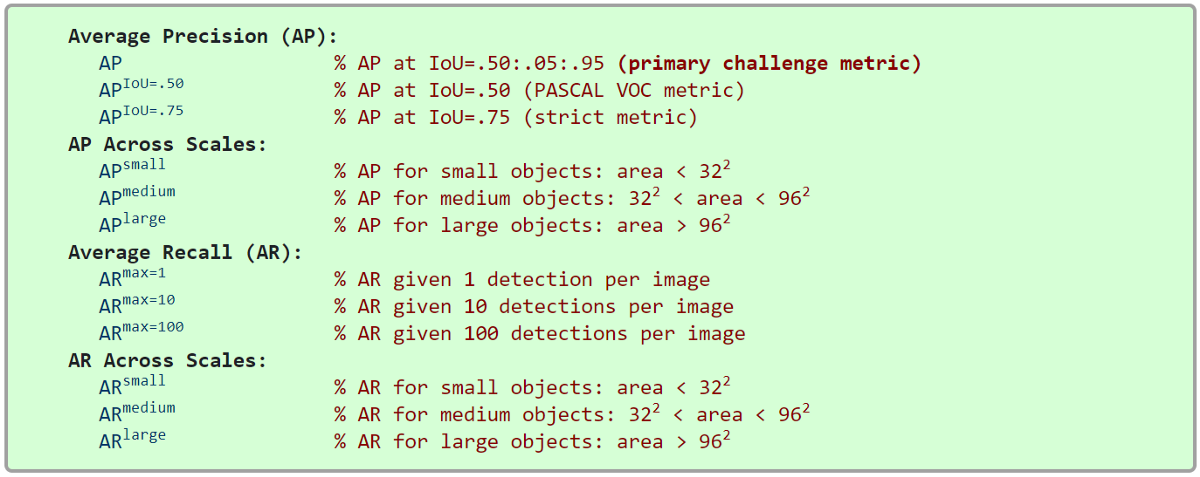
And, because my tutorial series is related to the YOLOv3 object detector, here is AP results from the author's paper:
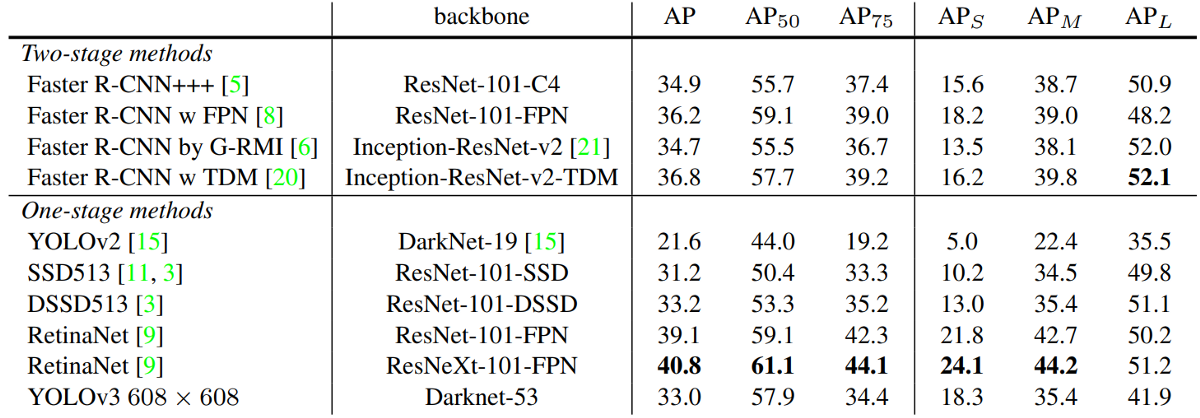
In the figure above, AP@.75 means the AP with IoU=0.75.
mAP (mean average precision) is the average of AP. In some contexts, we compute the AP for each class and average them. But in some context, they mean the same thing. For example, under the COCO context, there is no difference between AP and mAP. Here is the direct quote from COCO:
AP is averaged overall categories. Traditionally, this is called "mean average precision" (mAP). We make no distinction between AP and mAP (and likewise AR and mAR) and assume the difference is clear from the context.
Ok, let's get back to the beginning, where we need to calculate mAP. First, we need to set a threshold value for the IoU to determine if the object detection is valid or not. Let's say we set IoU to 0.5, in that case:
- If IoU ≥0.5, classify the object detection as True Positive(TP);
- If Iou <0.5, then it is a wrong detection and classifies it as False Positive(FP);
- When ground truth is present in the image, and the model fails to detect the object, we classify it as False Negative(FN);
- True Negative (TN): TN is every part of the image where we did not predict an object. This metrics is not helpful for object detection. Hence we ignore TN.
If we set the IoU threshold value to 0.5, then we'll calculate mAP50. If IoU=0.75, then we calculate mAP75. Sometimes we can see these as mAP@0.5 or mAP@0.75, but this is the same.
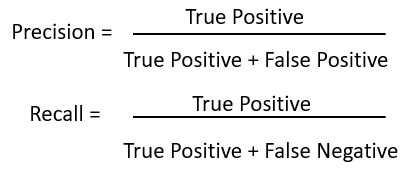
We use Precision and Recall as the metrics to evaluate the performance. Precision and Recall are calculated using true positives(TP), false positives(FP), and false negatives(FN):
 To get mAP, we should calculate precision and recall for all the objects presented in the images.
It also needs to consider the confidence score for each object detected by the model in the image. Consider all of the predicted bounding boxes with a confidence score above a certain threshold. Bounding boxes above the threshold value are considered positive boxes, and all expected bounding boxes below the threshold value are considered harmful. So, the higher the confidence threshold is, the lower the mAP will be, but we'll be more confident with accuracy.
So, how to calculate general AP? It's pretty simple. For each query, we can calculate a corresponding AP. A user can have as many questions as they like against his labeled database. The mAP is simply the mean of all the queries that the use made.
To see, how we get an AP you can check the voc_ap function on my GitHub repository. When we have Precision(pre) and Recall(rec) lists, we use the following formula:
for i in list:
    ap += ((rec[i]-rec[i-1])*pre[i])
We should run this above function for all classes we use.
To calculate the general AP for the COCO dataset, we must loop the evaluation function for IoU[.50:.95] 9 times. Here is the formula from Wikipedia:
Here N will be nine, and AP will be the sum of AP50, AP55, …, AP95. This may take a while to calculate these results, but this is how we need to calculate the mAP.
Practical YOLOv3 mAP implementation:
First, you should move to my YOLOv3 TensorFlow 2 implementation on GitHub. There is a file called evaluate_mAP.py. The complete evaluation is done in this script.
While writing this evaluation script, I focused on the COCO dataset to ensure it would work on it. So in this tutorial, I will explain how to run this code to evaluate the YOLOv3 model on the COCO dataset.
First, you should download the COCO validation dataset from the following link: http://images.cocodataset.org/zips/val2017.zip. Also, in the case for some reason you want to train the model on the COCO dataset, you can download and train the dataset: http://images.cocodataset.org/zips/train2017.zip. But it's already 20GB, and it would take a lot of time to retrain the model on the COCO dataset.
In TensorFlow-2.x-YOLOv3/model_data/coco/ is 3 files, coco.names, train2017.txt, and val2017.txt files. Here I already placed annotation files, that you won't need to twist your head where to get these files. Next, you should unzip the dataset file and place the val2017 folder in the same directory. It should look following: TensorFlow-2.x-YOLOv3/model_data/coco/val2017/images...
Ok, next we should change a few lines in our yolov3/configs.py:
- You should link
TRAIN_CLASSESto 'model_data/coco/coco.names'; - If you wanna train on the COCO dataset, change
TRAIN_ANNOT_PATHto 'model_data/coco/train2017.txt'; - To validate the model on the COCO dataset, change
TEST_ANNOT_PATHto 'model_data/coco/val2017.txt'; - To change the
input_sizeof the model, changeYOLO_INPUT_SIZEandTEST_INPUT_SIZEto your need, for example, to 512.
Now we have all settings set for evaluation. Now I will explain the evaluation process in a few sentences. The whole evaluation process can be divided into three parts:
- In the first part, the script creates an mAP folder in the local directory, in which it establishes another ground-truth folder. Here it makes a
.jsonfile for every ground-truth image bounding box; - In the second part, most part is done by our YOLOv3 model, and it runs predictions on every image. Similar way as in the first parts, it creates a
.jsonfile for every class we have and puts the detection bounding box accordingly; - In the third part, we already have detected and ground-truth bounding boxes. We calculate the AP for each class with a
voc_apfunction. When we have AP of each class, we average it, and we receive the mAP.
Here is the output of evaluate_mAP.py script, when we call it with score_threshold=0.05 and iou_threshold=0.50 parameters:
81.852% = aeroplane AP
12.615% = apple AP
31.034% = backpack AP
27.652% = banana AP
60.591% = baseball-bat AP
52.699% = baseball-glove AP
91.895% = bear AP
73.863% = bed AP
43.250% = bench AP
52.618% = bicycle AP
47.743% = bird AP
42.745% = boat AP
23.295% = book AP
52.714% = bottle AP
55.977% = bowl AP
31.840% = broccoli AP
81.399% = bus AP
49.839% = cake AP
52.939% = car AP
2.849% = carrot AP
87.444% = cat AP
46.828% = cell-phone AP
52.618% = chair AP
74.931% = clock AP
57.715% = cow AP
58.847% = cup AP
47.931% = diningtable AP
79.716% = dog AP
24.626% = donut AP
80.199% = elephant AP
79.170% = fire-hydrant AP
46.861% = fork AP
82.098% = frisbee AP
80.181% = giraffe AP
4.545% = hair-drier AP
27.715% = handbag AP
79.503% = horse AP
18.734% = hot-dog AP
73.431% = keyboard AP
39.522% = kite AP
27.280% = knife AP
75.999% = laptop AP
69.728% = microwave AP
67.991% = motorbike AP
79.698% = mouse AP
4.920% = orange AP
58.388% = oven AP
81.872% = parking-meter AP
71.647% = person AP
33.640% = pizza AP
53.462% = pottedplant AP
72.852% = refrigerator AP
37.403% = remote AP
23.826% = sandwich AP
43.898% = scissors AP
62.098% = sheep AP
67.579% = sink AP
73.147% = skateboard AP
46.783% = skis AP
56.955% = snowboard AP
64.119% = sofa AP
27.465% = spoon AP
47.323% = sports-ball AP
68.481% = stop-sign AP
60.784% = suitcase AP
64.247% = surfboard AP
60.950% = teddy-bear AP
78.744% = tennis-racket AP
55.898% = tie AP
31.905% = toaster AP
83.340% = toilet AP
39.502% = toothbrush AP
44.792% = traffic-light AP
88.871% = train AP
48.374% = truck AP
73.030% = tvmonitor AP
67.164% = umbrella AP
59.283% = vase AP
54.945% = wine-glass AP
84.508% = zebra AP
mAP = 55.311%
Conclusion:
I did this tutorial because it's valuable to know how to calculate the mAP of your model. You can use this metric to check how accurate is your custom-trained model with the validation dataset. You can check how mAP changes when you add more images to your dataset, change threshold, or IoU parameters. This is mostly used when you want to squeeze as much as possible from your custom model. I thought about implementing mAP into the training process to track it on Tensorboard. Still, I couldn't find an effective way to do that, so if someone finds a way to do that effectively, I would accept pull requests on my GitHub, see you in the next tutorial part! That's it for this tutorial part.